
- ForeverChemicals: UKHSA "most people likely have measurable levels PFAS" as "widespread" exposure food, drinking water, air..."
- Thoughts about Your cloud survived everything except the real world OPINION Rupert Goodwins Register columnist
- Eclipsed... beautiful in the leaves...
- British Palestine - historical - 31 October 1929
- Quotes-Printers are like that, I say. It's in their nature. They print when you don't need anything. And when you really need ..
- Pshaw - surprising July...
- Wicked Leeks - The government is negligent over glyphosate, says leading professor - Wicked Leeks
- Salt has never, ever been 'worth its weight in gold': that's a modern myth
- History Repeating....
- Failures in oversight of privatised water companies | Who broke Britain? i Paper’s opinion series; debate about modern Britain
Recent blog posts



Who's new
- myra poynter
- The Mighty Kiwi
- silverstar
- BUZZ
- Phil Corper
Who's online
There are currently 0 users and 0 guests online.
User login
Syndicate

Summer 2026
How was summer 2026 near you?
☀️ Temperature
In your area, the average daily high during June, July and August was 21.4C, according to provisional Met Office data.
This is 2.8C above the long-term summer average between 1991 and 2020.
Your area had about 18 days above 25C, the local temperature threshold for a heatwave.
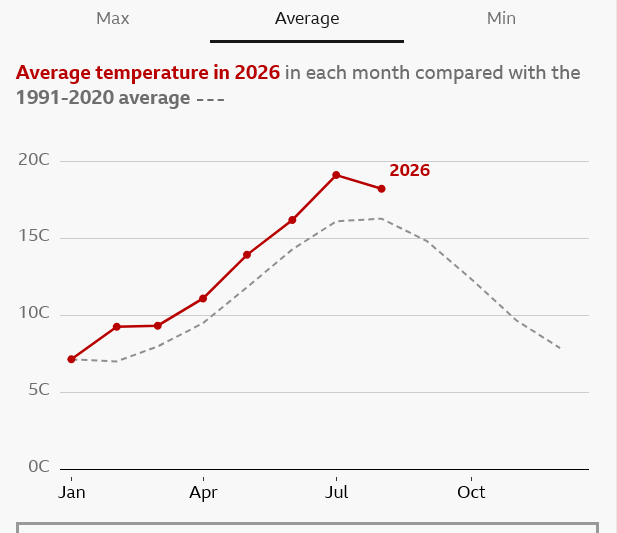
What about the year to date? Click the buttons in the chart below to see your local temperatures compared with the typical maximum, average and minimum.
Average daily maximum temperature in 2026 in each month compared with the equivalent for the 1991-2020 average
Maximum

Average

Minimum

Show data
In your area, summer temperatures were above average, based on average daily highs. Nearly everywhere in the UK was warmer than the long-term average this summer.

Average daily maximum temperature map key
Colder: blue
Warmer: red
-4C: deepest blue
No Change: white
+4C: deepest red
???? Rainfall
Approximately 133.2mm of rain fell in your area over three summer months.
This is roughly 37.5% below the long-term summer average between 1991 and 2020.
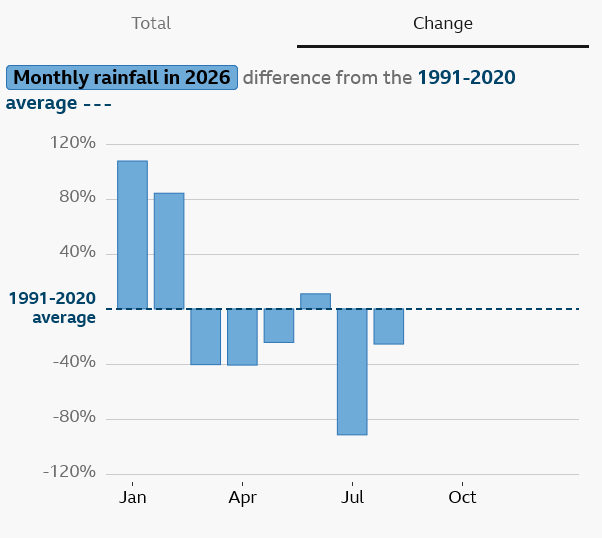
Click the buttons in the chart below to see your area's monthly rainfall and its difference from the long-term average.
Monthly rainfall in 2026 difference from the 1991-2020 average
Rainfall images
Total

Change
-120%-80%-40%1991-2020average40%80%120%JanAprJulOct
In your area, summer rainfall was below average this year. Most of the UK experienced a drier than average summer.

Total rainfall map key
Drier: brown
Wetter: blue
-100%: deepest brown
No Change: white
+100%: deepest blue
About the data

High-pressure weather systems sat over the UK for much of the summer, bringing clear, sunny skies for many parts of the country and creating warm, dry conditions.
But global warming - mainly the result of the burning of fossil fuels - is raising average temperatures in the UK.
This means that any warm spells can reach higher temperatures than the same weather systems of the past.
The Met Office estimates that this summer's average temperature was made about 130 times more likely by human-caused climate change.
Picture(s):
